
Imagine you’re carrying a bucket of water.
You need to bring water from the river to your garden to nourish a seed you’ve just planted.
But there’s a twist: you have to use two different buckets.
- Bucket A is for carrying water from the river to a tree at the halfway point.
- Bucket B is for transporting water from the tree to the garden. (Don’t ask why you need two buckets—it’s just part of the game!)
While using Bucket A , you notice it has many cracks and leaks a lot of water.
Bucket B also has cracks, but they’re smaller, so it leaks less.
You only have enough tape to fix one bucket.
Which bucket should you fix to ensure your seed gets the most water? Why?
Now, let’s apply this metaphor to TPT product sales.
Imagine 100 people land on your TPT product page.
- The next stage is the product preview only 10 people click on it.
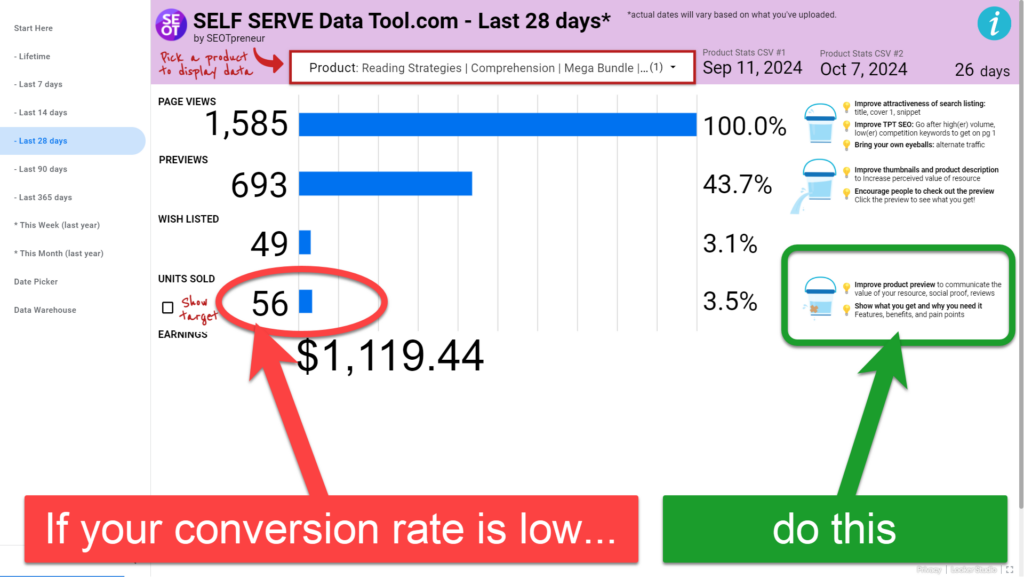
- The final goal is the purchase. Of the original 100 visitors, just 5 end up buying.
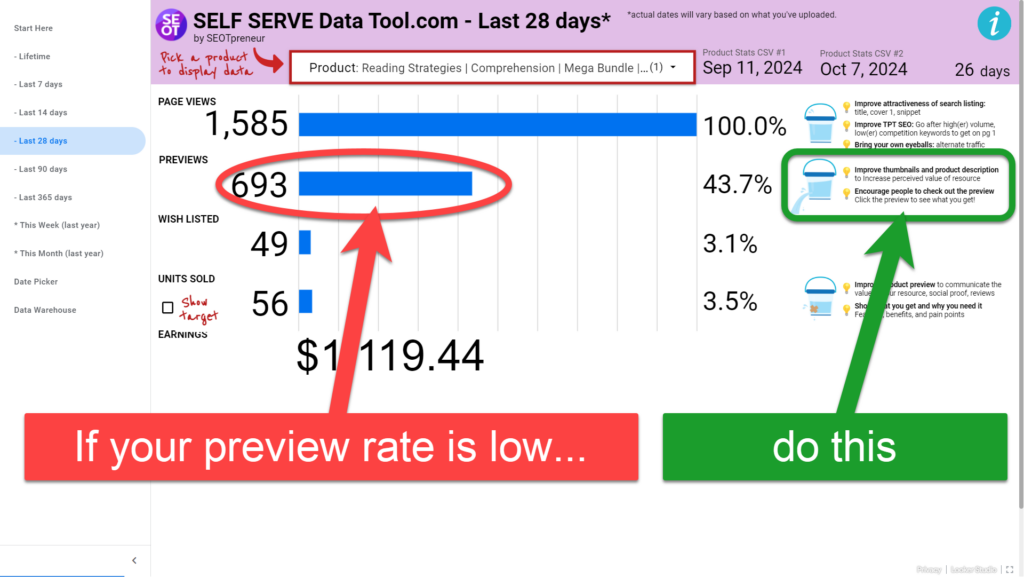
So, your product preview rate is 10%, and your conversion rate is 5%
If you improve your product preview rate, you’ll likely increase sales.
Maybe TPT SEO isn’t the issue… Even with more visitors, if 95% drop off before buying, it won’t help much. But if you “tape up” your preview rate, you might convert more visitors into buyers!
What if we worked with the traffic we already have?
Instead of always focusing on TPT SEO, maybe fixing your product preview rate is the better choice.
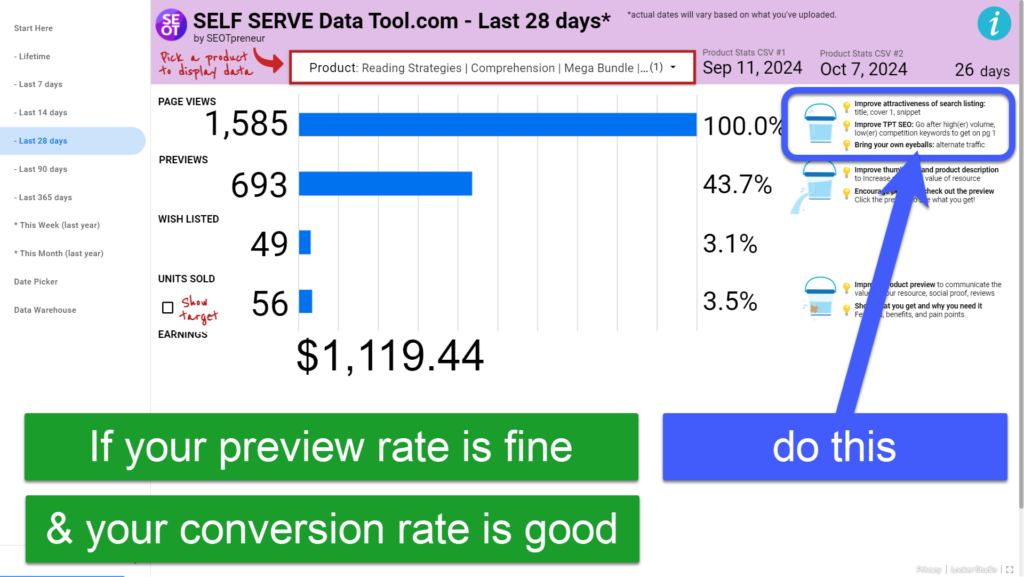
Or, your bucket might be pretty good with few leaks.
In that case, getting more water into the bucket (page views) might be what you need to work on.

How do I know what to fix?
Use the Self Serve Data Tool to visualize your TPT sales funnel. Pay attention to the “units sold” bucket and the “previews” bucket.
If your TPT conversion rate is low, do this:
if your TPT Preview Rate is low, do this:
If your TPT Conversion Rate is fine and your TPT Preview Rate is good, then do this:
How do I know what’s a good preview rate or conversion rate on TPT?
Great question. We’re starting a research project to answer that very question using data.
But for now, here are some guiding questions to help you make decisions.
Look at the sales funnel for your top 5 resources, one-by-one.
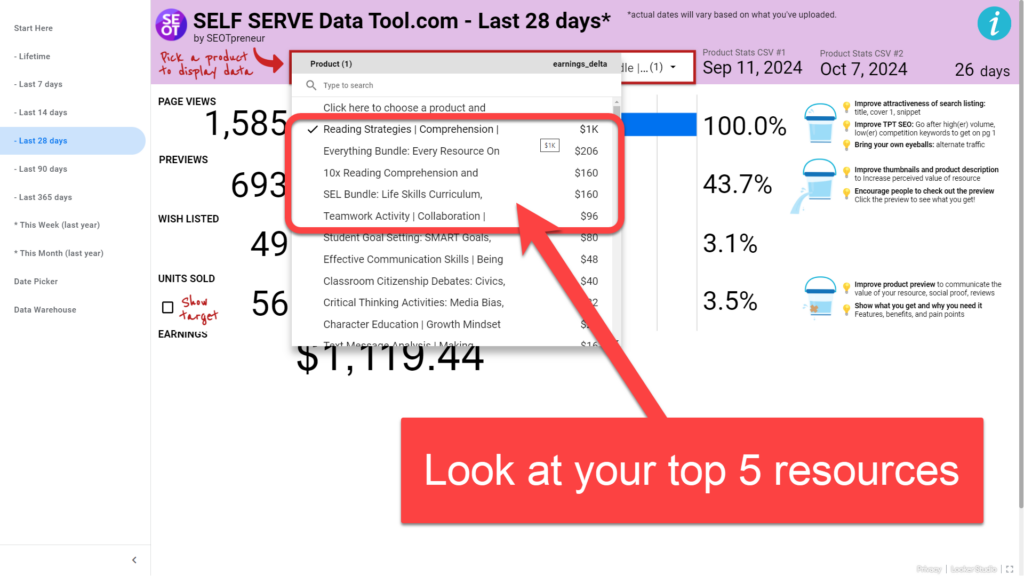
Compare the conversion rate and preview rates for your top 5 TPT products.
- Which resource has the lowest conversion rate? Why do you think that is?
- Which resource has the lowest preview rate? Again, why?
- Are there seasonal products in there that need to have keywords modified?
- Will you fix the product with the worst conversion rate first or go in order, and make one fix per product?
- Which is the easiest product to fix (to try to get a quick win?)
Yes, everyone has ideas or has heard a number of what a “good” conversion rate is. But, remember the way TPT tracks page views changed in July 2024 with Google Analytics 4. So those old benchmarks may not be reliable any more.
Instead of trying to beat the average, what if we focus on our personal best?
By focusing on our top 5 (or 10) products, we focus on the resources that actually make money in our store. Just compare the sold rate and preview rate among those products and fix the worst ones!
Click here to get access to the Self Serve Data Tool.